Nanopore Clogging in Exosome Measurement: Why It Happens and How to Work Around It
Anyone who has measured extracellular vesicles through a nanopore knows the failure mode. The run starts cleanly, the event rate is stable, and then it isn’t: the baseline current drifts, the count collapses, and the measurement has to be abandoned, the pore stretched, flushed, or replaced. Nanopore clogging during exosome measurement is not an occasional accident. It is a structural consequence of pushing a biological preparation through an aperture only slightly larger than the particles you want to count.
This page explains why blockage happens, what it does to your data before you notice it, how to reduce it, and what changes when the measurement principle involves no aperture at all. For the wider picture of what to measure on a vesicle preparation, see our overview of extracellular vesicle characterization.
Why nanopores block when measuring EVs
Resistive pulse sensing counts particles one at a time as each one transits a pore and momentarily displaces the ionic current. The physics is elegant and the resolution is real, but it depends on a geometric compromise: the pore must be small enough that a single vesicle produces a detectable current drop, and large enough that particles pass without lodging. That window is narrow, and several things in a real EV preparation attack it.
Polydispersity and the largest particle in the tube
A vesicle preparation is not monodisperse. Even a well-purified sample contains a tail of larger vesicles, and an unpurified one contains cell debris, apoptotic bodies and fragments an order of magnitude larger than the exosomes of interest. The pore is sized for the population you care about, which means the tail is sized wrong for the pore. One particle from the tail can end the run.
Aggregates form where you cannot see them
Vesicles aggregate in response to freeze-thaw cycles, buffer changes, protein carry-over and simple storage time. An aggregate that would be harmless in a cuvette becomes the single most consequential object in the sample when it reaches an aperture. Worse, aggregation is often the very thing that caused the blockage and is invisible in the resulting data: you see a failed run, not the reason for it.
Protein and lipoprotein fouling
Plasma, serum and conditioned media are crowded with protein and lipoprotein. These do not need to be large to matter — they adsorb progressively to the pore wall, narrowing it over the course of a session. The result is not an abrupt stop but a slow drift, which is considerably harder to detect and easier to interpret as a real biological trend.
Buffer constraints add their own bias
Because the signal is an ionic current, the measurement requires a conductive electrolyte at a defined concentration. Samples in low-conductivity buffers must be exchanged or spiked before they can be measured, and every one of those manipulations is an opportunity for vesicles to aggregate or adsorb — feeding straight back into the blockage problem.
What blockage does to your data before you notice
A fully blocked pore is the benign case: the run stops and you know the data is unusable. The costly cases are partial and progressive.
- Concentration is under-estimated. A partially occluded pore transits fewer particles per unit time. The count falls; the sample has not changed.
- The size distribution shifts. Constriction alters the relationship between current drop and particle volume, and a narrowed pore preferentially excludes the largest particles — so the mean diameter drifts downward for a purely instrumental reason.
- Session-to-session comparability degrades. If pore condition varies between runs, and pores are replaced between runs, part of your between-sample variance is pore variance.
- Throughput collapses unpredictably. Blockage does not distribute itself evenly across a plate. The dirtiest, most interesting samples fail most often, which biases which samples end up with data at all.
That last point deserves emphasis because it is a scientific problem, not a scheduling one. If unpurified samples fail more often than purified ones, your dataset is quietly enriched in clean samples.
Reducing blockage: what actually helps
If a pore-based method is the right tool for your question — and where you need surface charge alongside size, or resolution below 80 nm, it may well be — these measures genuinely reduce failure rate:
- Pre-filter or spin the sample to remove the large tail, accepting that you are also removing part of the population.
- Measure fresh where possible, and minimise freeze-thaw cycles, which are a dominant cause of aggregation.
- Filter the electrolyte itself; buffers are rarely particle-free.
- Bracket sessions with a reference material so drift is detected rather than inferred.
- Log pore identity with every result, so a change of pore never masquerades as a change of sample.
- Run a blank between dirty samples to catch carry-over and early fouling before it costs you a measurement.
These reduce the problem. None of them removes it, because the aperture is intrinsic to the method.
Removing the aperture: measurement in a free drop
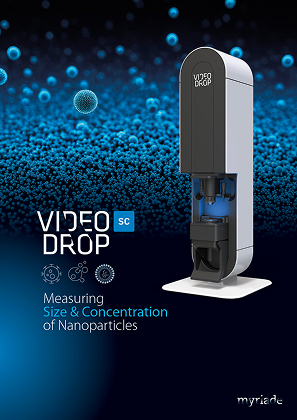
Interferometric light microscopy (ILM), the principle behind the Videodrop SC, detects and sizes particles optically, in a static 5–10 µL drop deposited on a slide. There is no pore, no capillary and no fluidic circuit anywhere in the measurement path. A camera coupled to dedicated signal processing detects the interference between the light scattered by each individual nanoparticle and the incident beam, which yields a number-based size distribution and a particle concentration per particle counted.
Three consequences follow directly, and they are the reason this page exists:
- Nothing can block. There is no aperture to occlude, so a large particle or an aggregate cannot end the run. Cleaning takes seconds, and for laboratories operating under cleaning validation, the absence of fluidics removes an entire category of complexity.
- Aggregates become data instead of failures. The live image shows debris and aggregates up to 10 µm directly. The object that would have ended a pore-based run is visible on screen — which is usually the finding you needed.
- Buffer conductivity is irrelevant. The signal is optical, so there is no electrolyte requirement and no buffer exchange step imposed by the instrument.
Because there are no camera settings or detection thresholds to tune and no calibration step, the measurement also does not depend on who performs it — and the whole cycle, loading to cleaning, runs in under a minute.
The honest trade-off
This is not a strict upgrade, and pretending otherwise would not help you choose. The ILM detection threshold sits at around 80 nm. Exosomes span roughly 30–150 nm, so the smallest vesicles in your preparation fall outside the measurement window. Pore-based sensing reaches lower, and it additionally returns surface-charge information that an optical count does not provide. The working concentration range is 108–1010 particles/mL, so very concentrated material still needs some dilution.
That trade-off was documented in a peer-reviewed comparison by Sausset et al. (2023), which placed ILM alongside particle tracking on extracellular vesicles and bacteriophages: a higher detection threshold, offset by greater speed, easier handling, fewer consumables and less small-particle masking in highly polydisperse populations. The practical question is therefore not which method is better but which failure you can least afford — missing sub-80 nm vesicles, or losing measurements to a blocked pore.
Choosing between them
A short diagnostic usually settles it. Is your critical population below 80 nm? If yes, you need a method that reaches lower, and an optical count can only complement it. Do you need surface charge? If yes, keep a pore-based method in the workflow. How dirty are your samples? The less purified the material, the more an aperture-free method earns its place. How many samples per week, and how reproducible must they be across operators? Where throughput and consistency dominate, removing the pore removes the dominant source of lost runs.
For many laboratories the honest answer is both: a fast, aperture-free count for routine and process work, and a higher-resolution method reserved for the questions that genuinely require it. On the labelling and concentration-range side of the same problem, see measuring EV concentration without staining.
Key takeaways
- Nanopore blockage is intrinsic to aperture-based counting, driven by polydispersity, aggregates and protein fouling.
- Partial blockage is more damaging than total blockage: it lowers counts and shifts size downward without any warning.
- Pre-filtration, fresh samples and reference bracketing reduce failures but cannot eliminate them.
- An optical measurement in a free drop has nothing to clog and makes aggregates visible — at the cost of an ~80 nm detection floor and no charge information.
Tired of losing runs to a blocked pore? See how the Videodrop SC sizes and counts vesicles in a single drop, with no fluidics — request a demonstration.
Choose your application



Choose your product
Measuring
Size & Concentration
of Nanoparticles
Size Kinetics
and Aggregation
of Nanoparticles