In Vivo CAR-T: Why Vector Particle Characterization Becomes a Product Quality Question
In conventional autologous CAR-T manufacturing, the lentiviral vector is a reagent. It transduces cells ex vivo, and what is administered to the patient is the cell product; residual vector is a process-related impurity to be cleared and controlled. Vector aggregation, in that setting, is primarily a yield and transduction-efficiency problem.
In vivo CAR-T changes the status of the vector entirely. The vector is no longer a reagent used during manufacturing — it is the drug product, administered directly. Everything in the vial goes into the patient, including whatever aggregated on the way there. An aggregate stops being a process inefficiency and becomes a product-related impurity: a variant of the active substance, present in the administered dose, with different biodistribution, different transduction behaviour and a different immunological profile from the monomeric particle it came from.
That reclassification is the reason particle-level characterization deserves more attention in an in vivo programme than in an ex vivo one. This page sets out what changes, what regulators expect of impurity control, and what can practically be measured.
Process-related versus product-related: why the distinction matters
Regulatory frameworks treat these two categories differently, and the difference is not administrative.
- Process-related impurities — host cell protein and DNA, nuclease, residual plasmid, serum components — originate outside the product. The expectation is removal, verified by a clearance study. Once cleared below a justified limit, the matter is settled.
- Product-related impurities — aggregates, degraded or damaged particles, empty and defective vectors — are variants of the active substance itself. They cannot simply be « removed »; they must be characterised, controlled through the process, and specified with justified acceptance criteria. Their levels are expected to be understood and reproducible, not merely low.
FDA’s guidance on CMC Information for Human Gene Therapy INDs (January 2020) frames CMC content around assuring the safety, identity, quality, purity and strength of the investigational product. For a directly administered vector, aggregation touches several of those at once — purity, because aggregates are an impurity; strength, because aggregated particles are not individually available to transduce; and quality, because aggregation state affects how the product behaves in vivo. Sponsors should read the applicable guidance in full and take their own regulatory advice; the point here is simply that a parameter treated as a yield metric ex vivo migrates into the quality section in vivo.
Why aggregation matters more when the vector is administered
Biodistribution
A monomeric particle of roughly 100–130 nm and a micron-scale aggregate do not travel the same way. Size is a primary determinant of distribution, clearance and mechanical entrapment in capillary beds. An in vivo product with a variable aggregate content has a variable biodistribution profile — which undermines the dose-response relationship the programme is built on.
Effective dose
Dose is typically expressed in vector genomes or particles. If a meaningful and variable fraction of those particles is bound into aggregates, the number of independently available transducing units differs from the nominal dose, batch to batch, in a way the release number does not capture.
Immunogenicity
For protein therapeutics, the association between aggregation and immunogenicity risk is well established and drives extensive analytical requirements. Enveloped viral vectors are not proteins, and the relationship should not be assumed to transfer quantitatively — but for a directly administered particulate biologic, aggregation is a plausible risk factor that reviewers can reasonably be expected to raise. Programmes that can show aggregation is measured and controlled are in a stronger position than those that cannot.
Comparability across process changes
Process changes are inevitable between phases and at scale-up. A comparability exercise that compares only titer and infectivity is not comparing aggregation state. If a new site or a new scale changes shear or hold conditions, the aggregate profile can shift while both headline numbers stay within specification.
The measurement gap
The routine assay panel does not see aggregation, and this is worth being explicit about because it is easy to assume otherwise:
- p24 ELISA quantifies capsid protein. A monomer and an aggregate of a hundred particles contain the same p24 per virion — the number does not move.
- qPCR / ddPCR quantifies genomes. Aggregation does not change genome content.
- Infectious titer registers a potency drop but cannot tell you the cause, and takes days.
- Ensemble sizing flags a mean-diameter shift but returns an intensity-weighted average dominated by large objects, with no particle count — it cannot quantify how many aggregates are present.
So a batch can pass its physical titer, its genome titer and a size check while carrying an aggregate burden that nobody has quantified. For a product administered to a patient, that is a gap worth closing.
What to measure, and where
A defensible aggregation-control strategy for an in vivo vector rests on measuring particles rather than surrogates, and measuring them often enough to see where aggregation originates:
- Total particle concentration alongside p24 and genome titer, so the three can be read against each other.
- Number-based size distribution, not an intensity-weighted average — a distribution that broadens is the earliest quantitative signal.
- Direct observation of aggregates and sub-visible particles, so their presence is evidence rather than inference.
- The same measurements at each process step, so the origin of aggregation is identified rather than only its endpoint. Concentration steps are the usual culprits — see lentivirus aggregation monitoring during TFF.
- Stability under intended storage and handling, including freeze-thaw and in-use conditions, since aggregation continues after release.
Where a fast particle measurement fits
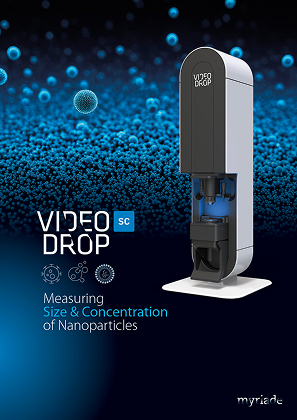
Interferometric light microscopy, the principle behind the Videodrop SC, provides a particle concentration and a number-based size distribution from a single 5–10 µL drop in under a minute, label-free and non-denaturing, with live imaging in which aggregates and debris up to 10 µm are directly visible. For a programme that needs aggregation data at many points across development and process characterization, the combination of speed and low sample consumption is what makes routine measurement realistic — and 21 CFR Part 11 compliant software is available as an option for laboratories working under those requirements.
Its role should be stated precisely. This is a physical, non-specific measurement: it counts particles in the 80 nm to ~10 µm range, it does not identify them as vector, and it does not report infectivity. It is well suited to process characterization, comparability support, formulation and stability screening, and to generating the aggregation data that no other routine assay produces. It is not, on its own, a release assay, and nothing here should be read as a claim that it satisfies a regulatory requirement. Qualification for any specific use, and the acceptability of any method in a regulatory filing, remain the sponsor’s responsibility and a matter for discussion with the relevant authority.
Key takeaways
- In vivo CAR-T reclassifies the vector from manufacturing reagent to administered drug product.
- Aggregates therefore become product-related impurities — characterised and controlled, not merely cleared.
- p24, qPCR and infectious titer are all blind to aggregation state; a batch can pass every routine assay with an unquantified aggregate burden.
- Particle-level data — count, number-based distribution, direct observation — closes that gap, as a characterization tool rather than a compliance claim.
Building an aggregation control strategy for a directly administered vector? See how the Videodrop SC quantifies particles and reveals aggregates in a single drop — request a demonstration.
Choose your application



Choose your product
Measuring
Size & Concentration
of Nanoparticles
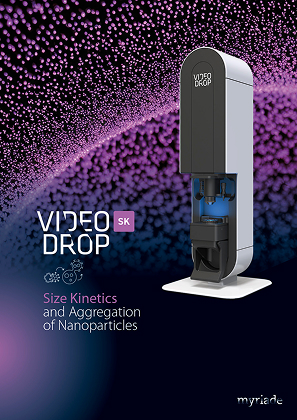
Size Kinetics
and Aggregation
of Nanoparticles