Lentivirus Aggregation Monitoring During TFF
Tangential flow filtration is where lentiviral vector campaigns most often lose material without knowing it. The step is designed to concentrate, and concentration is precisely the condition under which enveloped particles aggregate. The result is a familiar and frustrating pattern: transmembrane pressure creeps up, flux declines, the recovered titer is lower than the volume reduction predicts, and the post-mortem cannot separate membrane fouling from product loss because both happened and neither was measured while the run was open.
Lentivirus aggregation monitoring during TFF is about closing that gap. This page covers why aggregation is intrinsic to the step, what it costs, and what can realistically be measured during the run. For the wider downstream picture, see real-time lentivirus titer during purification.
Why TFF drives lentiviral aggregation
Lentiviral vectors are enveloped, fragile and relatively unstable in solution. Four features of TFF act on exactly those weaknesses.
Concentration polarisation at the membrane
Retained species accumulate in a boundary layer at the membrane surface, where the local concentration is substantially higher than in the bulk retentate. Aggregation kinetics depend on collision frequency, which scales with concentration — so the aggregation rate at the membrane can be far higher than the bulk concentration would suggest. The most aggregation-prone region of the system is the one you never sample.
Shear in recirculation
Material passes the membrane many times. Pump heads, valves and the retentate loop impose repeated shear and interfacial stress on a particle whose lipid envelope carries the glycoprotein needed for transduction. Damage accumulates with passes, not with time, which is why a slow run at low crossflow can be gentler than a fast one of equal duration.
Rising bulk concentration
Volume reduction is the objective, and it raises particle concentration by design. As the run progresses, the retentate moves deeper into the regime where aggregation is favoured — so aggregation risk is highest at the end, when the batch is most valuable.
Buffer exchange during diafiltration
Diafiltration changes ionic strength and composition, and colloidal stability depends on both. A buffer swap that is thermodynamically sensible for the final formulation may pass through conditions that destabilise the particle en route.
What aggregation costs
- Yield. Aggregates are retained on the membrane, contribute to the fouling layer and are removed at the subsequent sterile filtration step. Both are unrecoverable losses.
- Filterability. The 0.2 µm filtration that follows is where an aggregated batch reveals itself — often as a blocked filter and a sudden, large loss late in the process.
- Potency per particle. Particles inside an aggregate are not individually available to transduce a cell, so an aggregated preparation can lose infectious titer while its physical titer barely moves.
- Process attribution. Without a measurement during the run, elevated transmembrane pressure cannot be assigned to membrane fouling or to product aggregation. These have different corrective actions, and guessing wrong costs a campaign.
- Product quality. In an administered product, an aggregate is not only a yield problem — see in vivo CAR-T vector particle characterization.
What the standard read-outs miss
TFF is normally monitored by transmembrane pressure, flux and volume. These are process parameters, not product parameters: they tell you the system is struggling without telling you what is happening to the vector. Pressure rises for membrane fouling and for product aggregation alike.
The product-side assays available are all offline. p24 ELISA and qPCR return numbers hours later, and neither detects aggregation at all — the protein and the genome are unchanged when particles clump. An infectious titer takes days. An ensemble sizing technique can flag a shift in mean diameter, but it returns an intensity-weighted average heavily biased by large objects and gives no particle count, so it cannot distinguish a small number of large aggregates from a general size increase. By the time any of these reports, the run is finished and the decision point has passed.
Measuring particles and aggregates during the run
What a TFF operator needs is a product-side measurement fast enough to act on, small enough to take repeatedly without depleting the batch, and capable of showing aggregation directly rather than inferring it.
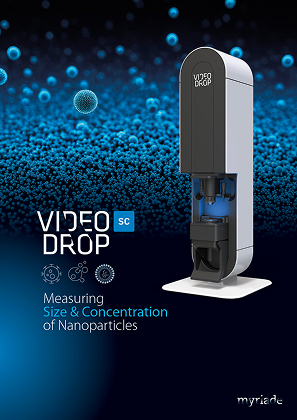
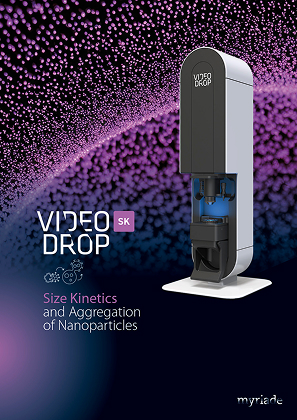
Interferometric light microscopy, the principle behind the Videodrop SC, fits that description on each count. A 5–10 µL drop is measured in under a minute, label-free and non-denaturing, returning a particle concentration and a number-based size distribution — alongside live imaging in which debris and aggregates up to 10 µm are directly visible. Because the volume drawn is negligible, retentate can be sampled repeatedly across the run without affecting the batch, and because there is no fluidic circuit in the instrument, an aggregate-rich sample cannot block it.
In practice this supports a simple monitoring pattern:
- Baseline the feed for particle concentration, size distribution and pre-existing aggregates before starting.
- Sample the retentate at intervals — typically at defined concentration factors — and watch three things together: does total particle count track the volume reduction, is the size distribution stable, are aggregates appearing in the image.
- Interpret pressure against product data. Rising transmembrane pressure with a stable size distribution and no visible aggregates points at membrane fouling. Rising pressure alongside a broadening distribution and visible aggregates points at the product. That distinction is the operational payoff.
- Measure the permeate to confirm the vector is being retained rather than passing through.
- Bracket diafiltration with measurements before and after, so a destabilising buffer transition is caught as it happens.
- Compare final retentate to feed to obtain a step recovery for TFF specifically, rather than a campaign-level yield.
Repeated across runs, this converts TFF from a step that is characterised after the fact into one with a monitored trajectory — and it turns crossflow rate, transmembrane pressure, concentration factor and buffer choice into parameters you can optimise against product-side evidence.
Honest limits
The measurement is a physical particle count: it does not report infectivity, and a functional assay remains necessary for the biologically meaningful dose. The detection threshold is around 80 nm — not a constraint for lentiviral vectors at roughly 100–130 nm, but relevant if you are also tracking smaller species. The working range is 108–1010 particles/mL, so a highly concentrated final retentate may need dilution. And an optical count is not vector-specific, so in the presence of substantial non-vector debris the total count includes it.
Within those bounds, the value is specific and worth stating plainly: aggregation becomes visible while the run is still open, at a moment when crossflow, pressure or endpoint can still be changed.
Key takeaways
- TFF drives aggregation through concentration polarisation, repeated shear, rising bulk concentration and buffer exchange.
- Aggregates cost yield twice: retained at the membrane, then removed at sterile filtration.
- Pressure and flux cannot distinguish membrane fouling from product aggregation; p24 and qPCR do not see aggregation at all.
- A sub-minute, 5–10 µL measurement with live imaging makes aggregation visible during the run, when the process can still respond.
Losing vector in concentration steps? See how the Videodrop SC tracks particle concentration and aggregation across TFF — request a demonstration.
Choose your application



Choose your product
Measuring
Size & Concentration
of Nanoparticles
Size Kinetics
and Aggregation
of Nanoparticles