Real-Time Lentivirus Titer During Purification
Most lentiviral vector processes are measured at two points: the harvest and the final product. Everything in between is inferred. When the campaign yield disappoints, the analysis begins with a small set of offline numbers arriving days later, and the honest conclusion is usually that material was lost somewhere in a five- or six-step sequence without anyone being able to say where.
A real-time lentivirus titer during purification changes the arithmetic. When a physical particle count takes under a minute and consumes 5–10 µL, it stops being an assay you schedule and becomes a reading you take — at every step, on both streams, while the run is still open. This page sets out what that enables across the downstream train. For the underlying comparison with p24 ELISA and qPCR, see rapid LVV titer without p24 ELISA.
Why offline titration cannot support process decisions
The constraint is not accuracy, it is latency. A p24 ELISA returns in hours; RT-qPCR in hours; an infectious titer in days. Downstream unit operations take minutes to hours. Any measurement slower than the step it monitors can only ever describe what already happened.
Three consequences follow. Losses are discovered after the fact, when no corrective action is available. Attribution is impossible, because without per-step data a 40% campaign loss cannot be assigned to clarification, TFF, chromatography or sterile filtration. And process development slows to the cadence of the assay: each optimisation cycle waits on a result, so few conditions get tested.
What a fast physical count makes possible
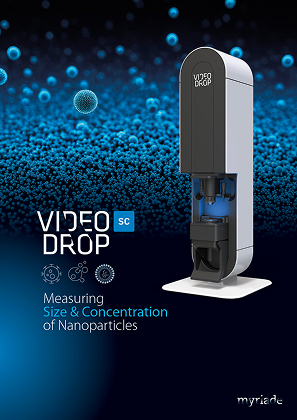
Interferometric light microscopy, the principle behind the Videodrop SC, measures particle concentration and a number-based size distribution from a single 5–10 µL drop in under a minute, label-free and non-denaturing, with live imaging of debris and aggregates up to 10 µm. Lentiviral particles at roughly 100–130 nm sit above the ~80 nm detection threshold, and process samples typically fall inside the 108–1010 particles/mL working range.
Three properties matter for in-process work, and all three are needed together. Speed means the result arrives before the next step begins. Volume means sampling does not deplete the batch, so you can measure often and on both streams. Tolerance of complex samples means viscous, polydisperse, minimally diluted process material can be read at-line rather than only in a dedicated analytics laboratory.
Step recovery: the measurement that changes the conversation
Measuring input and output of each unit operation converts an opaque campaign yield into an itemised balance sheet:
Step recovery (%) = (output concentration × output volume) / (input concentration × input volume) × 100
Two points make this more informative than it first appears. First, concentration alone is meaningless across steps that change volume — a concentration step should raise concentration without raising total particles, and confusing the two is a common source of false optimism. Always compute total particles. Second, measuring the waste stream is as valuable as measuring the product stream: a permeate, a flow-through or a filtrate that contains vector tells you immediately that the step, not the product, is at fault.
Across the downstream train
Harvest and clarification
The reference point for the whole balance, and the hardest sample: crude harvest contains cell debris, membrane fragments and free protein. An optical count is not vector-specific, so the total here includes non-vector particles — treat the harvest number as a baseline for trending rather than an absolute vector titer, and expect a step change as debris is removed. Measuring both clarified product and discarded solids shows whether vector is being lost with the debris, which is a common and correctable loss.
Nuclease treatment
Benzonase or equivalent digests residual nucleic acid. The particle count should be essentially unchanged; a drop indicates that incubation conditions are damaging the vector rather than only the DNA.
Concentration and diafiltration (TFF)
The step with the highest loss potential, and the one where aggregation is most likely. Total particles should be conserved while volume falls. Because this step needs its own treatment, see lentivirus aggregation monitoring during TFF.
Chromatography
On anion exchange, the useful measurement is particle recovery across the whole operation: load, flow-through, wash and eluate. Comparing particles loaded with particles eluted gives a direct recovery figure, and finding vector in the flow-through or wash immediately distinguishes a binding problem from an elution problem — a distinction that determines whether you change buffer conditions or gradient. Measuring eluate fractions as they come off supports pooling decisions in real time rather than retrospectively.
Sterile filtration
The last step and a frequent site of unexplained loss, almost always because aggregates formed earlier are removed at 0.2 µm. Measuring immediately before and after the filter quantifies that loss precisely; measuring size distribution and aggregate presence before filtering predicts it, and gives you the option of intervening first.
Formulation, fill and stability
Particle concentration in the final drug substance underpins dosing and batch comparison, and repeating the measurement over time under storage conditions turns stability testing into a routine reading rather than a study.
Building it into the process
- Define fixed sampling points — input and output of every unit operation, plus every waste stream.
- Report total particles, not just concentration, so volume changes do not distort the picture.
- Record the size distribution and the image at every point, not only the number. Aggregation shows up there first.
- Run a buffer blank for each buffer used, and subtract background.
- Establish per-step recovery ranges across several campaigns; a step drifting outside its own historical range is a signal well before the final yield reports it.
- Anchor to orthogonal assays periodically — p24 or qPCR for a vector-specific number, a functional assay for infectivity. The fast count trends the process; the orthogonal assays calibrate what the trend means.
Honest limits
This is a physical titer: it reports particles, not infectious units, and it cannot replace a functional assay. It is not vector-specific, which matters most in crude harvest and least after purification — consistent with the independent evaluation by Turkki et al. (Viruses, 2021), which found ILM particle counting especially useful for high-concentration, purified virus preparations, while non-purified sample types may be harder to characterise or may require standard-curve or background-subtraction strategies. And the 108–1010 particles/mL window means very dilute or very concentrated streams need handling.
Read correctly, those limits define the method’s place rather than diminish it: a fast, frequent, trend-oriented measurement that makes the process visible, backed by slower assays that make it specific.
Key takeaways
- Offline assays are slower than the steps they monitor, so they can describe losses but never prevent them.
- A sub-minute, 5–10 µL count enables per-step recovery across the entire downstream train, on product and waste streams alike.
- Always report total particles rather than concentration alone, or volume changes will mislead you.
- Physical, non-specific and range-bounded — anchor the trend periodically with p24, qPCR and a functional assay.
Want to stop working blind between purification steps? See how the Videodrop SC delivers an at-line physical titer in under a minute — request a demonstration.
Choose your application



Choose your product
Measuring
Size & Concentration
of Nanoparticles
Size Kinetics
and Aggregation
of Nanoparticles