Transfection Efficiency Variability in AAV Production: Start With the Complex
Transient transfection remains the dominant route to AAV, and it remains the least reproducible step in the process. Two runs from the same cell bank, the same plasmid lots and the same nominal protocol can differ substantially in yield, and the investigation usually turns to cell density, passage number, plasmid ratio or media lot. One candidate is routinely overlooked, largely because it is rarely measured: the transfection complex itself.
The PEI-DNA polyplex is not a reagent you add — it is a nanoparticle you manufacture, in a beaker, minutes before use, under conditions that are seldom controlled to the standard applied elsewhere in the process. If the complex differs between runs, the transfection differs, and so does the yield. This page is about characterising that complex. For the wider application, see transfection mix monitoring.
Scope: what is and is not measured here
This needs stating before anything else, because it determines whether this page is useful to you.
The Videodrop SK measures the transfection complex — the PEI-DNA polyplex formed upstream, before it reaches the cells. It does not measure the AAV particle. The AAV capsid is approximately 25 nm, well below the ~80 nm detection threshold of the technology, so AAV titer, capsid content and full/empty ratio are outside what this instrument can do, and we do not claim otherwise. Those measurements require other methods entirely.
What is on offer is upstream: understanding and controlling the input that drives transfection, so that the downstream yield becomes more reproducible. If your question is about the AAV particle itself, this is not the right tool. If your question is why your transfections vary, read on.
How polyplex formation drives transfection outcome
Polyplexes form by electrostatic self-assembly: the cationic polymer condenses anionic plasmid DNA into a compact nanoparticle. Self-assembly is fast, kinetically controlled and sensitive to how it was performed — which is exactly why it varies.
- Size governs uptake. Complex diameter influences the endocytic route and the efficiency of internalisation. Different size populations are taken up differently, so a size shift is a transfection shift.
- Homogeneity governs predictability. A narrow distribution means most complexes behave alike. A broad or multimodal distribution means the outcome is an average over sub-populations whose proportions vary run to run.
- Aggregation is a hard failure. Complexes continue to grow after formation. Micron-scale aggregates sediment rather than being internalised, so effective dose falls even though nominal DNA and PEI are unchanged.
- Concentration matters. How many complexes you actually add per cell is a real variable, and it is not fixed by the mass of DNA weighed out.
Why nominally identical preparations differ
Several parameters shift the complex without appearing in a protocol deviation:
- N/P ratio — the charge ratio between polymer nitrogen and DNA phosphate is the primary determinant of size and stability. Small errors in concentration propagate straight into it.
- Mixing energy and order of addition — because assembly is kinetic, how fast and in which direction the two solutions are combined changes the product. This is a notorious source of operator-to-operator and scale-to-scale variation.
- Incubation time before addition — complexes evolve. A mix used at five minutes is not the mix used at thirty.
- Ionic strength and buffer — salt screens the electrostatic interactions that hold the complex together and accelerate aggregation.
- DNA quality and plasmid lot — supercoiled fraction and purity affect condensation behaviour.
- Scale — mixing hydrodynamics do not transfer from a tube to a stirred vessel, which is why a protocol optimised at small scale often disappoints at production scale.
All of these are controllable. But they cannot be controlled if the complex is never measured, and in most workflows it never is: the mix is prepared, incubated for a fixed time and added, with the first read-out arriving days later as a yield number that conflates everything.
Measuring the complex before you add it
Interferometric light microscopy, the principle behind the Videodrop SK, measures particle concentration and a number-based size distribution from a single 5–10 µL drop in under a minute, label-free, with live imaging of aggregates and debris up to 10 µm. PEI-DNA polyplexes typically form in the 100 nm to several hundred nanometre range, inside the measurement window — and, importantly, the measurement is fast enough to be completed within the incubation window, before the complex is added to the bioreactor.
That timing is the whole point. A measurement returning after transfection is an autopsy; a measurement returning in under a minute is a release decision on the mix.
Practical uses:
- Formation kinetics. Measure at intervals after mixing to see how size and count evolve, and choose an incubation time on evidence rather than convention.
- N/P optimisation. Screen ratios quickly and map each to complex size, homogeneity and aggregate content.
- Mixing method comparison. Quantify what order of addition, rate and geometry actually do to the product — essential before scale-up.
- Lot-to-lot qualification. Check that a new PEI or plasmid lot produces the same complex as the qualified one, before committing a production run.
- Go / no-go on the mix. If the complex is aggregated or out of its established size range, you know before the bioreactor is committed rather than a week later.
- Correlate complex attributes with yield. Over a series of runs, this is what turns a hypothesis about transfection variability into a controlled parameter.
Honest limits
Beyond the AAV exclusion stated above, three constraints apply. The detection threshold is around 80 nm, so any sub-80 nm complex population is not counted — relevant if your formulation produces very small polyplexes. The working concentration range is 108–1010 particles/mL, so concentrated mixes may need dilution — and since dilution can itself destabilise a polyplex, use a consistent, documented dilution protocol and treat the results as comparative. Finally, the measurement is physical: it characterises the complex, it does not predict transfection efficiency on its own. Its value comes from correlating complex attributes with outcomes across your own runs.
Key takeaways
- The transfection complex is a nanoparticle you manufacture on the bench, and it is usually the least controlled input in AAV production.
- Size, homogeneity, aggregation and concentration of the polyplex all drive transfection outcome and therefore yield.
- N/P ratio, mixing energy, incubation time, ionic strength and scale all shift the complex without any protocol deviation.
- A sub-minute measurement fits inside the incubation window — and the AAV particle itself, at ~25 nm, is explicitly out of range.
Want your transfections to stop being the variable step? See how the Videodrop SK characterises the transfection complex before it reaches your cells — request a demonstration.
Choose your application
Choose your product
Measuring
Size & Concentration
of Nanoparticles
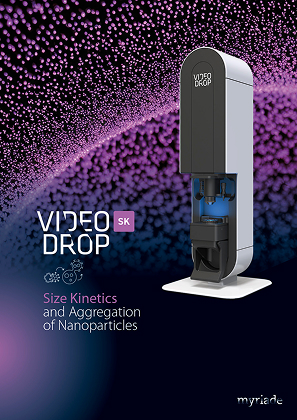
Size Kinetics
and Aggregation
of Nanoparticles